
Naivas Waterfront Cold Chain Analytics Report
Naivas Waterfront Cold Chain Report
Report by Yvonne Mukhono
Monitoring Period: 24 February 2026 – 11 March 2026
This report analyses operational performance, temperature stability, power reliability, and device health of the Naivas Waterfront Rafu device. The objective is to assess whether the device maintained safe temperature conditions, identify power disruptions, and evaluate overall system health.
Executive Overview
The overview represents Key Performance Indicators (KPIs) summarizing the entire monitoring period.
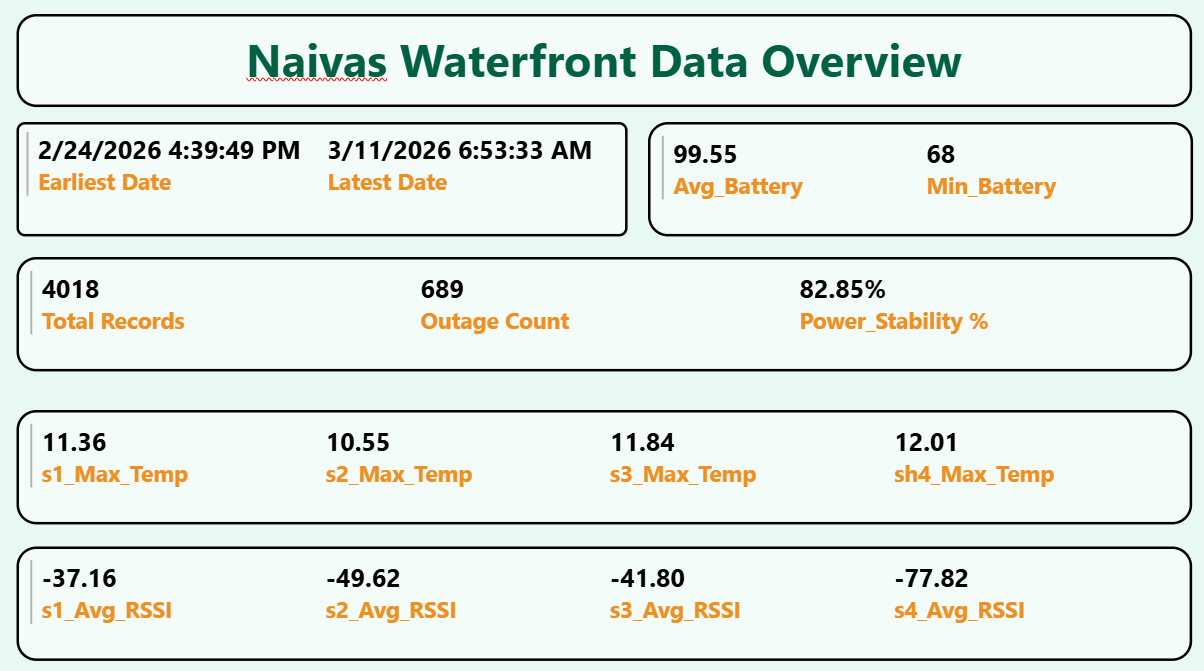
The following metrics summarize system performance:
|
Metric |
Value |
Interpretation |
|
Earliest Date |
24th Feb 2026 |
Start of monitoring window |
|
Latest Date |
11th Mar 2026 |
End of monitoring window |
|
Total Records |
4018 |
Telemetry data points captured |
|
Outage Count |
689 |
Number of detected power outages |
|
Power Stability |
82.85% |
Percentage of time with stable power |
|
Avg Battery |
99.55% |
Battery remained near full capacity |
|
Min Battery |
68% |
Lowest battery level recorded |
The device collected over 4,000 telemetry records, indicating consistent data transmission. Power stability was approximately 82.85%, meaning the refrigeration unit experienced intermittent power disruptions. However, the device’s backup battery remained highly reliable, with an average level above 99%, ensuring continued monitoring even during outages.
The sensors recorded the following maximum internal temperatures:
-
s1 - 11.36°C
-
s2 - 10.55°C
-
s3 - 11.84°C
-
s4 - 12.01°C
These temperatures are above the recommended cold-chain threshold (typically 2–8°C for refrigerated goods), suggesting occasional thermal deviations.
The RSSI values show generally strong connectivity, although sensor 4 shows weaker signal strength(-77.82), which may affect data reliability.
Temperature Behaviour
The temperature behaviour analysis focuses on temperature patterns within the refrigeration unit.
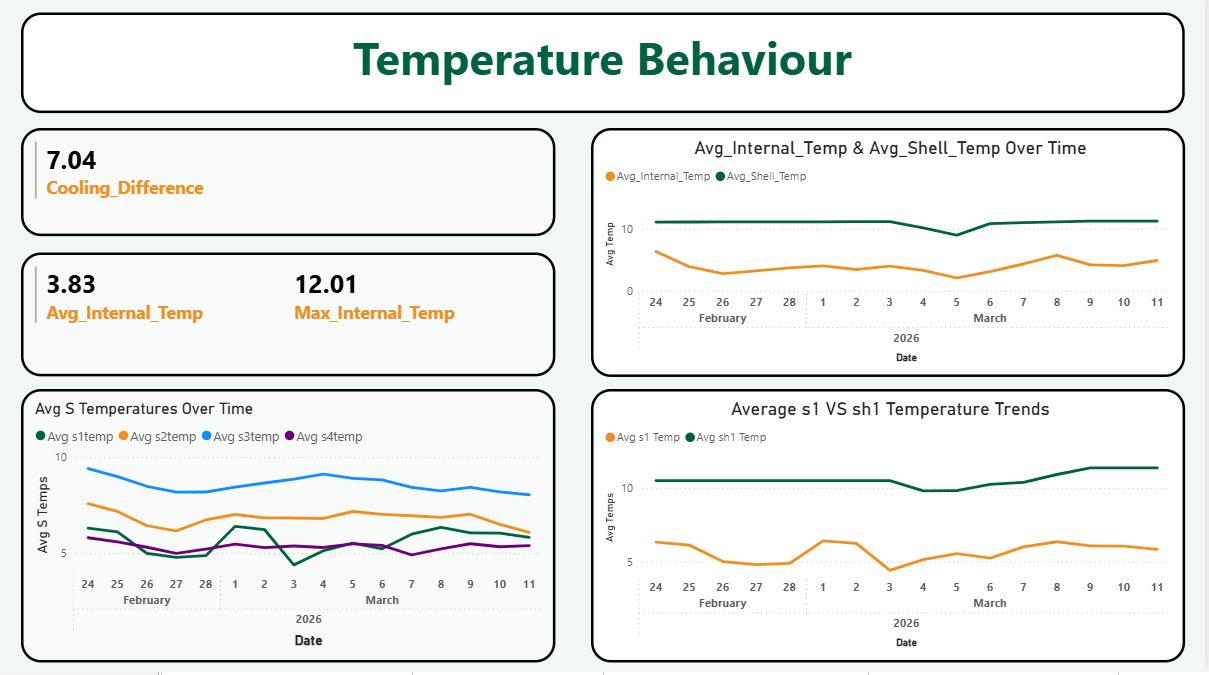
Cooling difference:
The cooling difference represents the temperature gap between the device shell temperature and the internal temperature environment. A cooling difference of 7.04°C indicates that the refrigeration unit maintains a significant thermal gradient between the external casing and the internal storage environment.
This suggests:
-
The refrigeration system is actively removing heat from the internal storage space.
-
The insulation and cooling mechanism are functioning effectively.
-
The internal environment remains substantially cooler than the surrounding shell area.
A stable cooling difference is a positive indicator of efficient thermal regulation.
Internal temperature metrics:
The average internal temperature across the monitoring period is 3.83°C, which indicates that the refrigeration unit maintained appropriate cooling conditions for most of the monitoring period.
The maximum internal temperature recorded was 12.01°C, which could point to temporary temperature excursions, like door openings, product loading, compressor cycling, power interruptions, and/or external environmental influence.
Although the average temperature remains safe, the presence of temperature spikes represents potential cold-chain risk if such events occur frequently or for prolonged durations.
Internal Vs shell temperature behaviour:
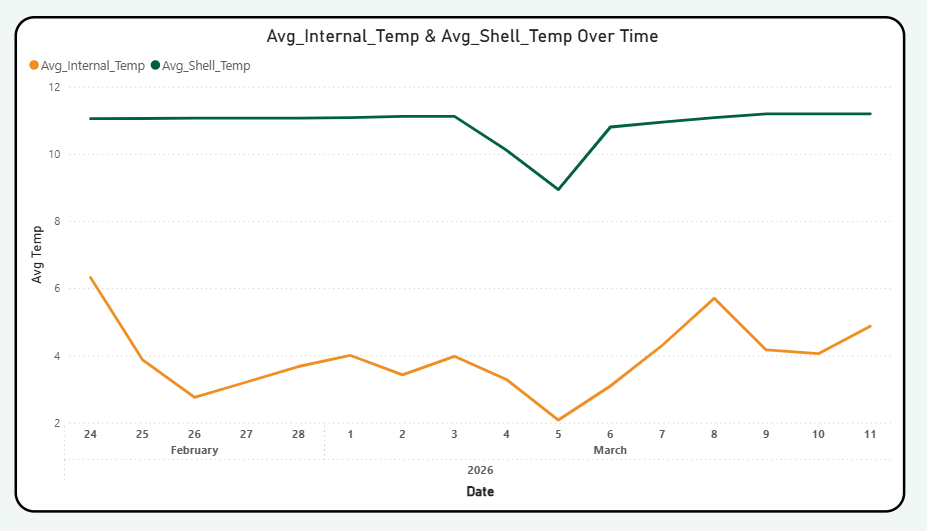
The line chart compares the average internal temperature and average shell temperature across the monitoring period. Shell temperature remains consistently higher than internal temperature. Shell temperature remains around 10°C–12°C, while internal temperature fluctuates between approximately 2°C and 7°C.
A noticeable dip in shell temperature occurs around March 4–5.
The consistent difference between shell and internal temperature confirms:
-
The refrigeration unit is maintaining controlled internal cooling.
-
Heat transfer between the external environment and internal compartment is limited by insulation.
Overall, the relationship between shell and internal temperature suggests stable refrigeration performance.
Average sensor temperature over time:

This visual displays temperature readings from four internal sensors(s1-s4).
Sensor s3 consistently records the highest temperatures, ranging approximately between 8°C and 10°C. Sensor s2 shows moderate temperatures, typically between 6°C and 8°C. Sensors s1 and s4 record the lowest readings, generally between 4°C and 7°C.
The differences between sensor readings suggest temperature variation within the refrigeration unit. Possible reasons include:
-
Sensor placement relative to airflow paths
-
Proximity to the cooling evaporator
-
Exposure to door openings
-
Product placement inside the refrigerator
The fact that the sensors follow similar trends over time indicates that the temperature changes are system-wide rather than isolated sensor anomalies.
However, the consistently higher readings from sensor s3 may indicate a localized warmer zone, which could be a potential point of concern if it approaches upper cold-chain limits.
Sensor Vs shell temperature comparison:
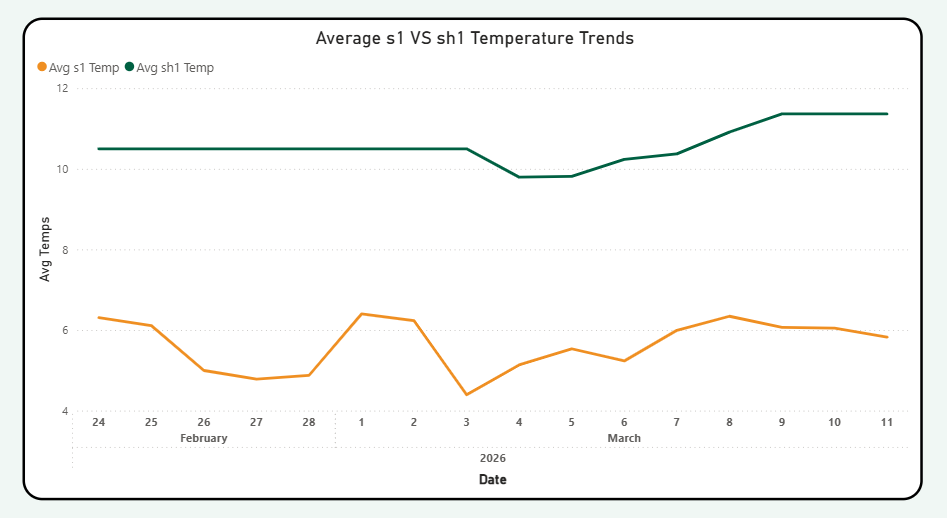
The shell temperature remains consistently higher than internal sensor temperature. Shell temperature fluctuates between approximately 10°C and 12°C. Sensor s1 temperature remains mostly between 4°C and 7°C. A small temperature dip around March 3rd - 4th is observed in both measurements.
The consistent gap between shell and internal temperatures indicates that:
-
Heat from the external environment is not rapidly penetrating the internal storage area.
-
The cooling system is maintaining a stable internal environment despite external fluctuations.
-
Shell temperature remains consistently higher than internal temperature, confirming effective cooling separation.
Power Reliability
The power reliability page analyses the relationship between power availability and temperature stability.
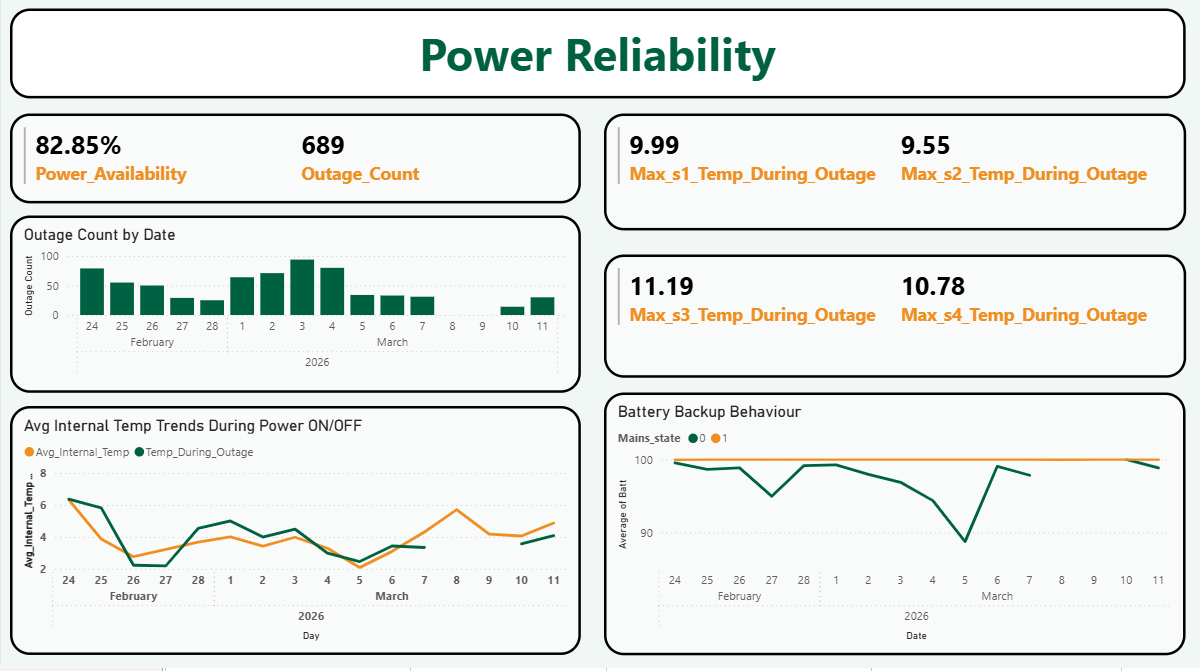
Power availability is 82.85%, so the power supply was not completely stable during the monitoring period.
Frequent outages can affect refrigeration performance, leading to temperature spikes.
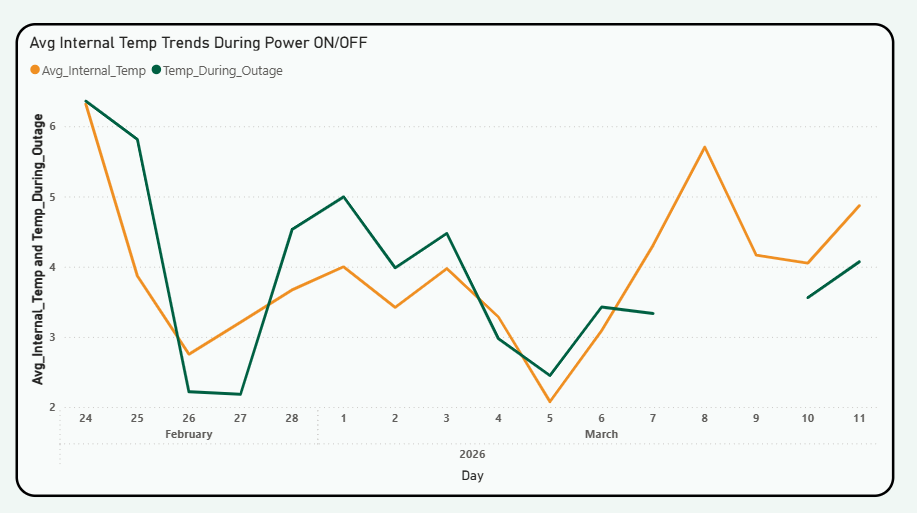
The average internal temperature trends during mains power ON and OFF states line chart compares the temperature differences when there is power vs when there is no power.
During power outages, temperatures tend to rise gradually due to:
-
Compressor shutdown
-
Reduced cooling capacity
-
Dependence on residual cold storage
However, the increase appears moderate rather than extreme, indicating the refrigerator retains cold air reasonably well.
Battery backup behaviour:
This chart shows battery levels during outages.
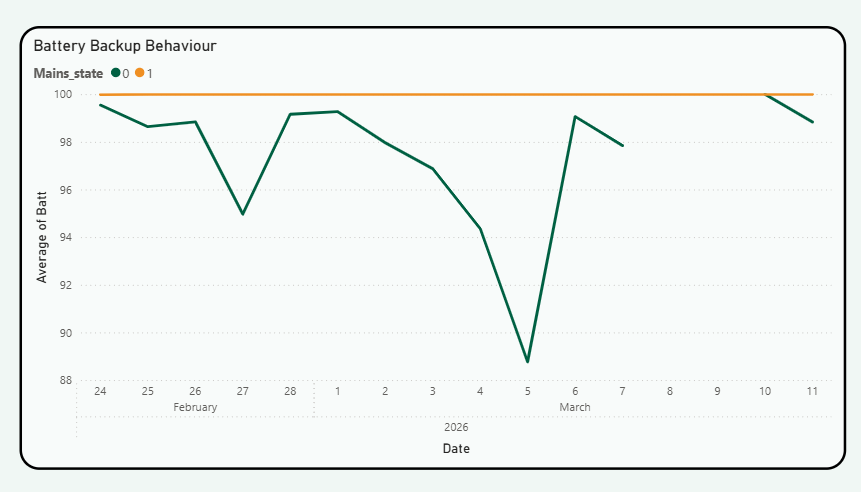
The battery level remains above 90% most of the time. No rapid battery depletion occurs and the device maintains operation during power failures
The device’s battery backup system is reliable, ensuring uninterrupted monitoring even when mains power fails.
Device Health Monitoring
This page evaluates the operational condition of the monitoring device itself.
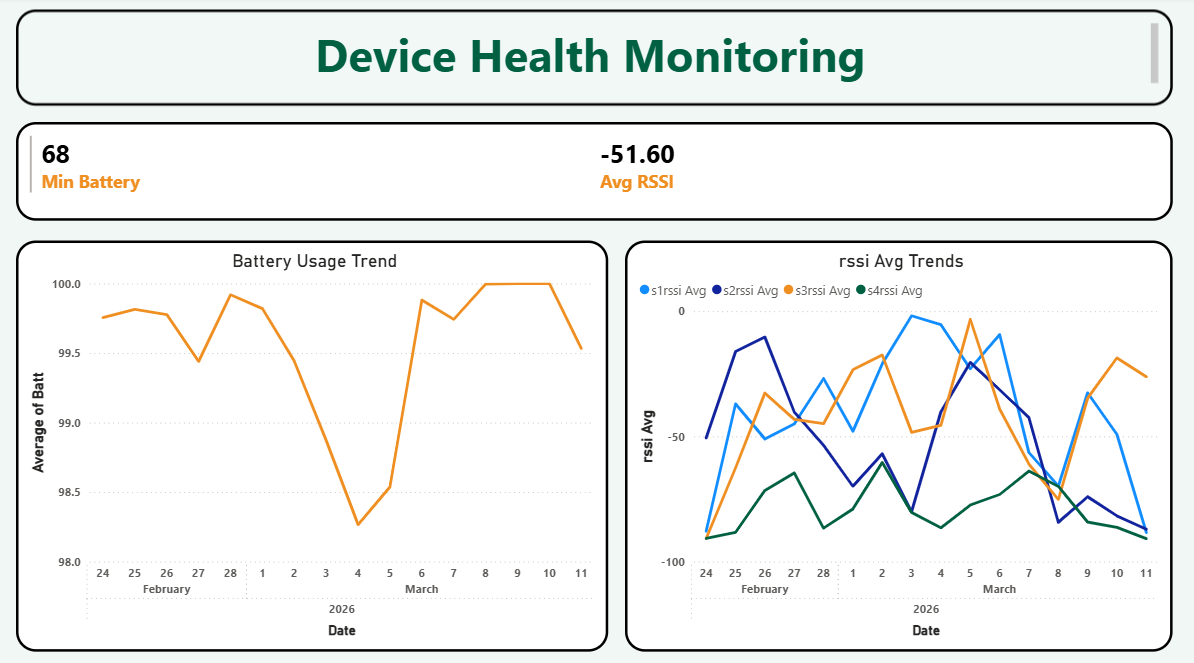
Battery usage trend:
Battery levels remain consistently between 98.5% and 100%, indicating:
-
Minimal battery degradation
-
Efficient power management
-
Reliable backup during outages
Minimum battery recorded is 68%, which likely occurred during extended outage periods.
RSSI average trends:
RSSI measures signal strength between the device and network.
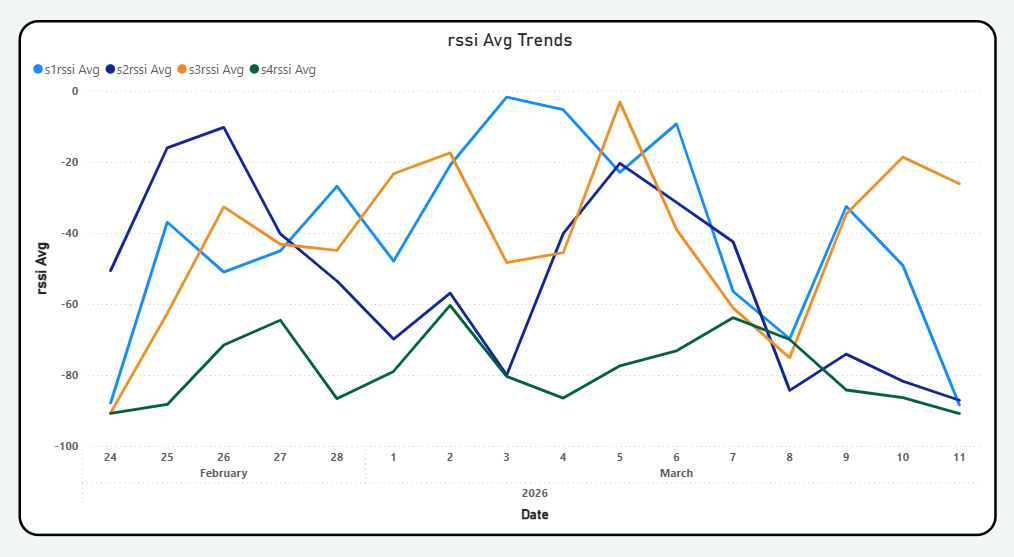
Most sensors maintain stable connectivity, ensuring reliable telemetry transmission.
However, sensor 4 shows weaker signal strength, which may result from device placement, structural obstructions, network interference, etc.
Improving antenna placement could enhance signal quality.
Overall System Assessment
Based on the analysis of all dashboard pages, the cold-chain device demonstrates the following characteristics.
Strengths:
-
High battery reliability
-
Consistent telemetry data collection
-
Strong network connectivity
-
Functional backup during power outages
-
Uniform temperature distribution across sensors
Identified Risks:
-
Frequent Power Outages - there are 689 outages detected with power availability being only 82.85%.
-
Temperature Spikes - the maximum temperature reached 12.01°C, which is above recommended cold storage limits for some products.
-
Connectivity Variation - Sensor 4 shows a noticeably weaker RSSI
Conclusion
The cold-chain monitoring device is functioning effectively in terms of data transmission, battery reliability, and temperature monitoring. However, frequent power outages and occasional temperature spikes pose potential risks to refrigerated goods.
Addressing power reliability and improving temperature stability will significantly enhance the overall effectiveness of the cold-chain monitoring system.
No comments to display
No comments to display